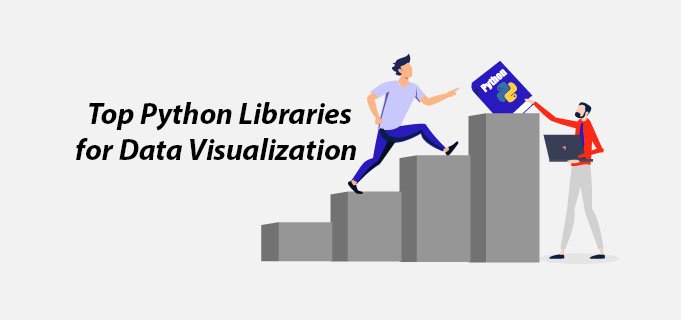
Top Python Libraries for Data Visualization: Unleashing the Power of Visual Insights

Data visualization is a vital aspect of data analysis that enables us to uncover patterns, trends, and insights from complex datasets. Python, with its rich ecosystem of libraries, has become a popular choice for data visualization tasks due to its flexibility, ease of use, and powerful visualization capabilities. In this blog, we will explore some of the top Python libraries for data visualization and how they can be leveraged to create impactful visualizations.
-
Matplotlib: Matplotlib is the workhorse of data visualization in Python. This library allows users to create a wide range of static, interactive, and animated plots. Its simple syntax and extensive customization options make it a go-to choice for data analysts and scientists. Whether you need simple line charts, bar plots, scatter plots, or more complex visualizations, Matplotlib has got you covered.
-
Seaborn: Built on top of Matplotlib, Seaborn focuses on producing aesthetically pleasing statistical graphics. It is particularly useful for visualizing relationships between variables, especially when working with Pandas DataFrames. Seaborn's high-level functions make it effortless to create complex plots, such as violin plots, pair plots, and heatmaps, with just a few lines of code.
-
Plotly: Plotly is a powerful library for creating interactive visualizations that can be embedded in web applications or Jupyter notebooks. With support for 3D plots, interactive maps, and dashboards, Plotly lets you create engaging and dynamic data visualizations that encourage exploration and interactivity.
-
Bokeh: Bokeh is another library for interactive data visualizations, which can be deployed in web applications. It provides a flexible and concise API to create interactive plots, linked plots, and widgets that allow users to explore and interact with the data.
-
Pandas: Although primarily known for its data manipulation capabilities, Pandas also offers basic plotting functions that are convenient for quick data visualization. You can directly plot Pandas DataFrames or Series, making it a handy choice for exploratory data analysis.
-
Altair: Altair is a declarative statistical visualization library that simplifies the process of creating complex visualizations. Based on a "grammar of graphics" approach, Altair allows you to create sophisticated visualizations with concise and intuitive Python code.
-
ggplot and Plotnine: Inspired by R's ggplot2, both ggplot and Plotnine provide a high-level interface for creating visualizations with a grammar of graphics approach. These libraries are particularly useful for users familiar with ggplot2 in R.
-
Holoviews: Holoviews abstracts away the complexities of data visualization by providing a high-level API that works seamlessly with Matplotlib, Bokeh, and Plotly backends. It allows users to create interactive visualizations effortlessly.
-
geopandas: For working with geospatial data, geopandas is the library of choice. It integrates seamlessly with Matplotlib to create visually compelling geospatial visualizations, such as choropleth maps and geographic plots.
In this blog, we've explored some of the top Python libraries for data visualization, each with its own unique strengths and purposes. Whether you're looking for static, interactive, or geospatial visualizations, Python's vast ecosystem of visualization tools has you covered. By leveraging these libraries, data analysts and scientists can effectively communicate insights and trends hidden within data, ultimately making better-informed decisions. So, don your data visualization hat and let these powerful Python libraries unleash the true potential of your data insights. Happy visualizing!
What's Your Reaction?


